
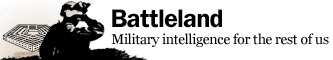


This chart comes from a just-released Rand Corp. study that concludes U.S. military information operations – psyops or propaganda, in less polite company – in Afghanistan have grown increasingly unsuccessful with the Afghan population over the past decade.
Speaking of info ops – have you ever seen a chart with a timeline that moves from the present back into the past as you move along the x-axis to the right?
If the chart were arranged in the traditional form – with the oldest time point on the left, and moving to the right into the present and future – you might conclude things are going pretty well. After all, the red “wrong direction” bars are falling, and the blue “right direction” bars are generally growing.
In fact, there’s a term for this at the Pentagon: shifting something to the right means pushing it off into the future.
Alas, if you glance at this chart and take from it what your decades of chart-reading have taught you (including its title, which specifies “2004-2010”), you’d get it exactly backwards. You have to read the labels to realize things are getting worse.
Psyops, indeed.